Process imagery using Google Earth Engine (GEE)
GEE based on Google map uses a multi-functions operational script and combines a multi- petabyte catalog of satellite imagery and geospatial datasets with planetary-scale analysis capabilities. GEE makes it available for scientists, researchers, and developers to detect changes, map trends and quantify differences on the Earth’s surface and make other multi-functional operations [8].
The GEE work field consists of two main parts (Figure 20).
- Includes satellite data folder, code section and data download field.
- There will be geographical and satellite maps of the world, from which the research area will be selected using special tools (draw a shape, draw a rectangle, geometry imports).

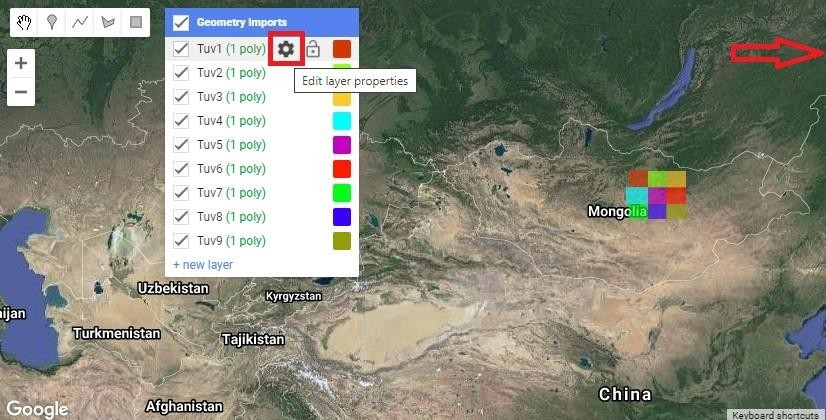
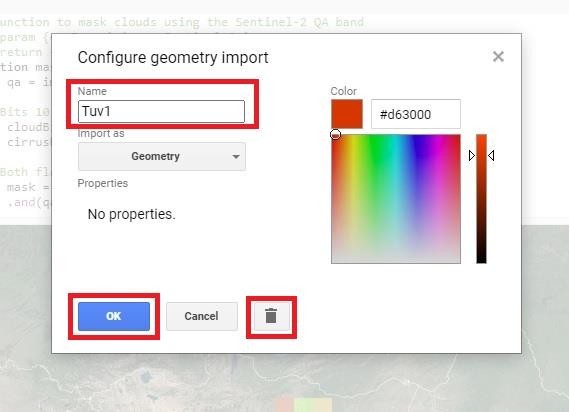
Draw a rectangle to mark the study area from the geographic and satellite maps section of the world and a polygon imagery and output file of the study area will be created on Geometry imports (Figure 21a). User can also rename or delete the polygon imagery by Edit layer properties section of the output file (Figure 21b). Depending on the size of the study area, it is possible to create several polygon imageries together with the output file.
For example, 9 geographic location imageries were created in Tuv province, and the output file name was given from Tuv1 to Tuv9. These output files are stored in the Imports section of the code section at the top of the GEE work field.


RGB imagery of Tuv province was made using GEE script using Sentinel-2 satellite data with a spatial resolution of 10-meter. This is delivering with notes or explanations of following codes.
Insert input data source and geographical location (Figure 22):
a. Source of variable or input data /var source:/ shall be pointed. b. Enter the geographical information of the study area /var Tuv1:/. In Figure 21, 9 geographical location imageries were created for the territory of Tuv province, and it was named Tuv1 to Tuv9.

Make cloud mask in satellite data (Figure 23):
Following data /script/ shall be changed in accordance with the code specified in Figure 23.
a. Information of imagery option /var qa = image.select(‘QA60’);/ shall be inserted. b. Percent of cloud mask of the imagery /var cloudBitMask = 1 << 10; var cirrusBitMask = 1<< 11;/ shall be inserted.
 // Function to mask clouds using the Sentinel-2 QA band
 // @param {ee.Image} image Sentinel-2 image
 // @return {ee.Image} cloud masked Sentinel-2 image
 function maskS2clouds(image) {
  var qa = image.select('QA60');
  // Bits 10 and 11 are clouds and cirrus, respectively.
  var cloudBitMask = 1 << 10;
  var cirrusBitMask = 1 << 11;

  // Both flags should be set to zero, indicating clear conditions.
  var mask = qa.bitwiseAnd(cloudBitMask).eq(0)
      .and(qa.bitwiseAnd(cirrusBitMask).eq(0));

  return image.updateMask(mask).divide(10000);
}
Load input data and make imagery (Figure 24):
a. Open data /var dataset = ee.ImageCollection(‘COPERNICUS/S2’)/ b. Select data term /.filterDate(‘2020-05-01’,’2020-09-30’)/ c. The percentage of cloud data /.filter(ee.FILTER.lt(‘CLOUDY_PIXEL_PERCENTAGE’,20))/ d. Make cloud mask in the source data /.map(maskS2clouds);/ e. Select bands of the source data /bands: [‘B4’, ‘B3’, ‘B2’],/

Create output file of imagery (Figure 25):
a. Median of the selected term /var coper2 = dataset.median()/ shall be loaded. b. Boundary of the selected province /Map.centerObject(Tuv1);/ shall be pointed. c. Function to break boundary of the province ///Map.addLayer(coper2.clip(geometry), rgbVis, 'RGB');/ shall be inserted. For its reason following operations shall be done.
• Altitude data ///Map.addLayer(elevation.neq(0))/ shall be pointed. • A boundary of the selected province /Map.addLayer(Tuv1, {color:'blue'}, 'inundated')/ shall be pointed. • The selected imagery /Map.addLayer(above10.clip(Tuv1), rgbVis, 'above10')/ shall be cliped by boundary of the province. • Band 4, 3, 2 datasets of such imagery shall be selected by 10-meter /var img = above10.visualize({bands:['B4', 'B3', 'B2'], min: 0, max: 0.3})/ spatial resolution. • Image clip by boundary of the province shall be copied into Google drive /Export.image.toDrive({/. For copying following operations shall be done. Also, selecting imagery shall be saved with following formats. /image: img,/ - indicate extension of such imagery. /description: 'RGB_Tuv1',/ - output file name shall be given and for such imagery and save it. /scale: 10,/ - spatial resolution of such imagery shall be selected. /maxPixels: 3e9,/ - maximum pixels of such imagery shall be selected. /region: Tuv1})/ - name of the selecting province shall be typed.

The 9 RGB imageries from Tuv province generated by GEE code will be merged using ArcMap. To do this, select Data Management Tools → Raster → Raster Dataset → Mosaic to New Raster in the ArcToolbox tool of ArcMap and merge the created 9 imageries (Figure 26).

After merging the imageries, use the Spatial Analyst Tools → Extraction → Extract by Mask in ArcToolbox tool of ArcMap to clip the imagery into a boundary shape file (.shp) for the selected area. This imagery of the selected area save as a JPEG (.jpg) using the File → Export Map tool.